


Why Choose Us?
0% AI Guarantee
Human-written only.
24/7 Support
Anytime, anywhere.
Plagiarism Free
100% Original.
Expert Tutors
Masters & PhDs.
100% Confidential
Your privacy matters.
On-Time Delivery
Never miss a deadline.
Read carefully! This is a practice assessment in order to find someone who is capable of doing the real exam
Read carefully! This is a practice assessment in order to find someone who is capable of doing the real exam. I will obviously pay more for the real assessment. The assessment is based in Australian
Part A [12 marks in total]
A recent study reported that New Zealand smart phone subscribers averaged 4.3 hours per week watching videos on their smart phones.
A film studies lecturer wanted to do a hypothesis test to find out if this average is true for New Zealand university students or not. She asked all the students in her large first year film studies class at Massey University how many hours they spent watching videos on their smart phones during the previous week. 50 students responded. Summary statistics (in hours per week) for the data are:
Sample mean = 6.99
Sample standard deviation = 3.35
Standard error = 0.4742
-
Explain why a one-sample t-test is appropriate for this data. [1 mark]
-
State the null hypothesis for this test. [1 mark]
-
Calculate the test statistic for this hypothesis test. The formula is given below. [1 mark]
|

|
-
The p-value for the hypothesis test is 7.565e-07. State the decision with reason. [1 mark]
-
State the conclusion for this hypothesis test. [1 mark]
-
Are the conditions for this hypothesis test met? Explain. [2 marks]
Part A continues on next page...
-
Calculate a 95% confidence interval for the average time New Zealand university students spend watching videos on their smart phones. [2 marks]
-
Explain how the confidence interval adds to your conclusion. [1 mark]
-
The lecturer wondered if she should have selected her sample some other way. Discuss problems with her sampling method. [2 marks]
Part B [11 marks in total]
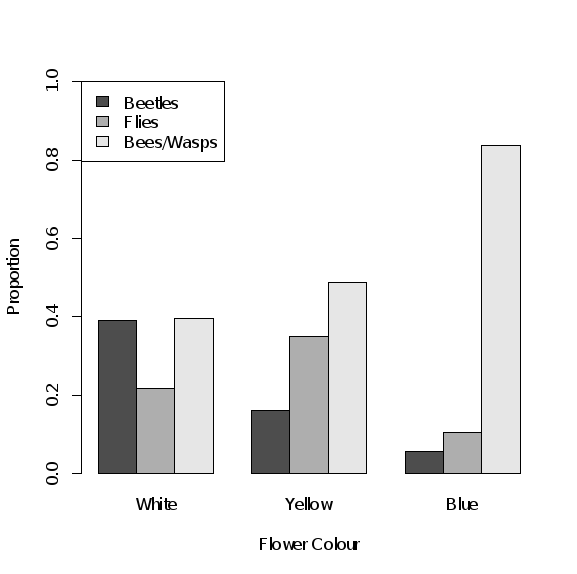
Researchers were interested in the effect of flower colour on insect pollination. They counted the number of insects from three different species (Beetles, Flies and Bees/Wasps) that visited white, yellow and blue flowers during a 24hour period. The table and graph below summarise their results.
|
Flower Colour |
||||||
|
White |
Yellow |
Blue |
Total |
|||
|
Type of insect |
Beetles |
56 |
34 |
12 |
102 |
|
|
Flies |
31 |
74 |
22 |
127 |
||
|
Bees/Wasps |
57 |
103 |
175 |
335 |
||
|
Total |
144 |
211 |
209 |
564 |
||
-
The researchers suspected that the different coloured flowers will attract different types of insect. Does the table or graph show this more clearly? Explain. [2 marks]
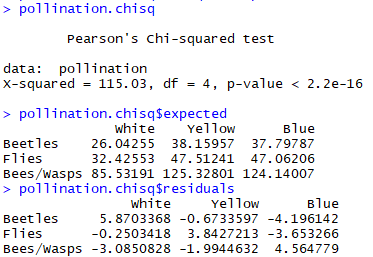
RStudio was used to do a Chi-squared test on this data. The RStudio output for the test, the expected counts and the residuals are below.
Part B continues on next page...
-
State the null hypothesis for this Chi-squared test. [1 mark]
|
|
-
What is the value of the test statistic? [1 mark]
-
State the decision for this hypothesis test with reason. [1 mark]
-
State the conclusion for this hypothesis test. [1 mark]
-
The expected counts are given in the output at the top of this page. Show how to calculate the expected count for flies on yellow flowers. [1 mark]
-
Are the conditions for this hypothesis test met? Justify your answer. [2 marks]
|
|
-
Do the residuals add to the conclusion or just confirm it? Explain. [1 mark]
Part B continues on next page...
-
A biologist questions the need for the Chi-squared test. He says the conclusion is obvious from looking at the graph and table of the data. Explain why the chi-squared test is important. [1 mark]
Part C [11 Questions worth 16 marks in total]
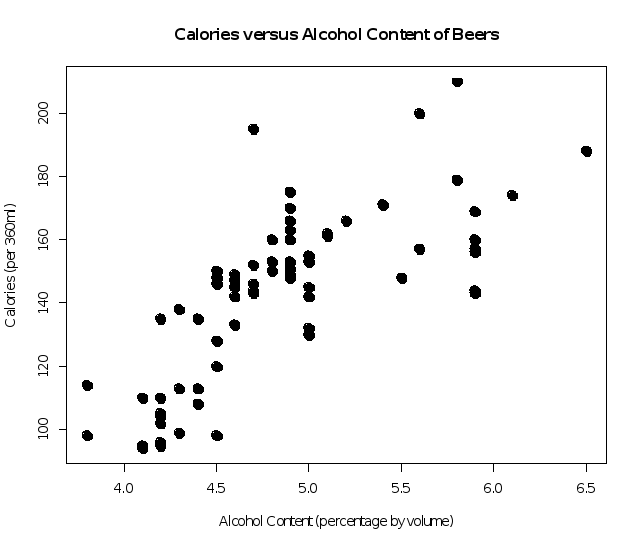
A statistics student wanted to see if there is a relationship between the calories and alcohol content of beer. He recorded the calories (per 360ml) and alcohol content (percentage) for the first 85 beers listed on the webpage of a local supermarket.
The data is shown in the scatterplot below. The correlation coefficient is also shown below.
![]()
-
What does the scatterplot and the correlation coefficient tell us about the relationship between the calories and alcohol content of beer? [2 marks]
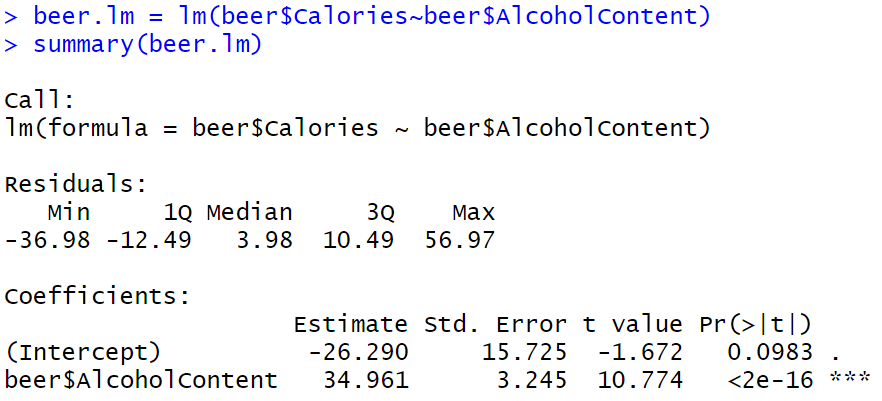
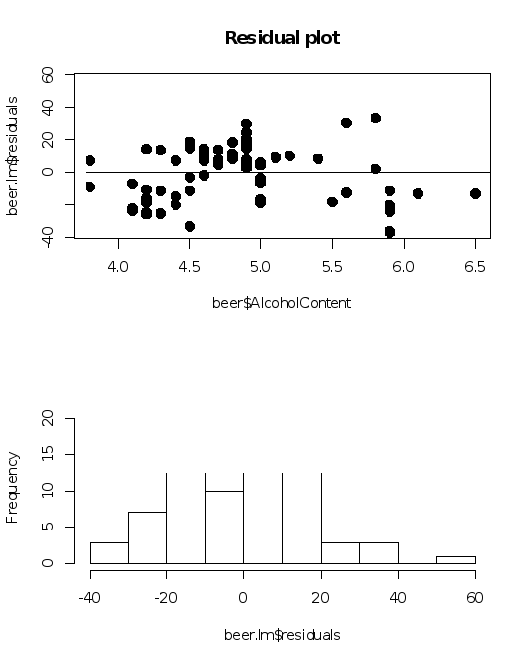
RStudio was used to fit a linear model to the data. Below are the RStudio output, the residual plot and a histogram of the residuals.
Part C continues on next page...
-
Write down the linear model equation. [1 mark]
Part C continues on next page...
-
What is the intercept and what does it tell us? [2 marks]
-
What does the slope tell us? [1 mark]
-
One of the beers has 130 calories (per 360ml) and has an alcohol content of 5%. Calculate the value of the residual for this beer. [2 marks]
-
Are the conditions of the linear model met? Explain. [2 marks]
-
What is the null hypothesis of the test for the slope? [1 mark]
-
State the decision for the test for the slope with reason. [1 mark]
-
What is the conclusion for this test? [1 mark]
-
Are the conditions met for the test for the slope? Explain. [2 marks]
-
The study above did not take account of the fact that there are different types of beer (e.g. lager, ale, stout). Explain how this information could be used to improve the sampling method. [1 mark]
Part D [6 Questions worth 12 marks in total]
A study was carried out looking for links between diet and development of Alzheimer’s disease. 341 elderly people participated. For six years researchers tracked what these participants ate and drank, and monitored who went on to develop Alzheimer’s. The participants were subsequently divided into two groups based on the amount of tea they drank each day. The group that drank 3 or more cups of tea daily were called Group A. The other group drank less than 3 cups of tea per day were called Group B.
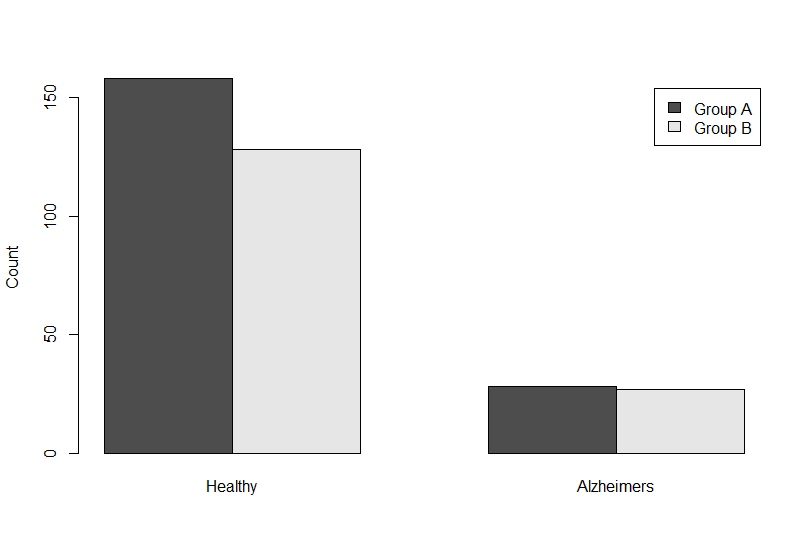
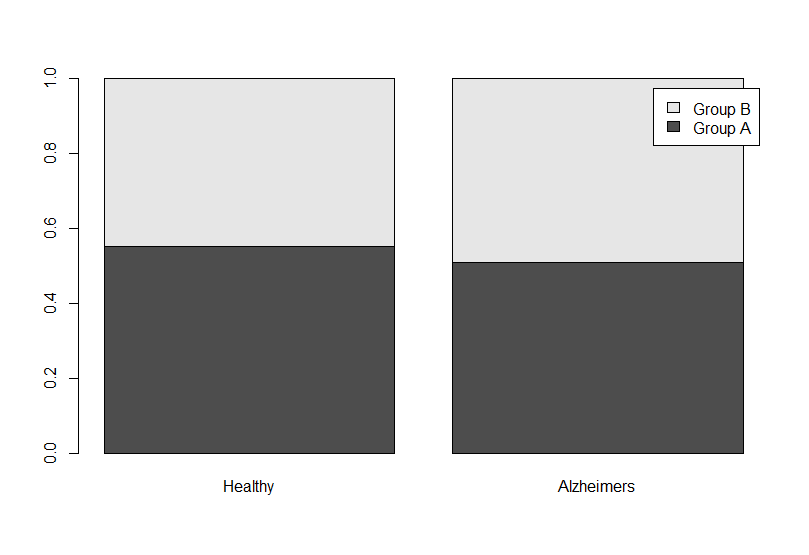
The results are summarised in the plots below:
|
|
|
|
Graph 1 |
Graph 2 |
-
What does Graph 1 tell you? [2 marks]
-
What does Graph 2 tell you? [1 mark]
A two-sample hypothesis test of proportions was carried out. Below are the hypotheses for this test.
The null: There is no difference between the proportion with Alzheimer’s in the two groups.
The alternative: There is a difference between the proportion with Alzheimer’s in the two groups.
The test gave a p-value of 0.001181.
The 95% confidence interval for the difference between proportions (Group B – Group A) has a lower limit of 0.0568 and an upper limit of 0.236.
Part D continues on next page....
-
State the decision for the hypothesis test with reason. [2 marks]
-
State the conclusion for the hypothesis test. [1 mark]
-
Explain how the confidence interval adds to this conclusion. [2 marks]
-
This study was reported with the headline ‘Drinking tea cuts threat of Alzheimers’. Explain why this headline is not justified by this study. [2 marks]
-
A statistician commented that the Alzheimer’s study described above could be improved by using an experimental design to control for lurking variables. Describe two potential lurking variables and an experimental design to control for these. [2 marks]
+ + + + + + +
Expert Solution
Need this Answer?
This solution is not in the archive yet. Hire an expert to solve it for you.
