


Why Choose Us?
0% AI Guarantee
Human-written only.
24/7 Support
Anytime, anywhere.
Plagiarism Free
100% Original.
Expert Tutors
Masters & PhDs.
100% Confidential
Your privacy matters.
On-Time Delivery
Never miss a deadline.
The production function and economic growth The production function of a hypothetical economy is: Q-T(L,K) The Q stands for Real GDP; the T stands for the technology coefficient; the L stands for labor, and the stands for capital
The production function and economic growth The production function of a hypothetical economy is: Q-T(L,K) The Q stands for Real GDP; the T stands for the technology coefficient; the L stands for labor, and the stands for capital. The graphical representation of this production function is given as follows. REAL GDP (Q) 02 LABOR (L) Suppose that the economy is currently at Point A, where: Q1 = 0.5(4,5)
Suppose that the economy is currently at Point A, where: Q1 = 0.5(4,5) Now suppose the economy moves to Point B on the graph. Which of the following expressions is most likely to represent the new Real GDP? Q2 = 0,5 (3,5) O Q2 -0.5 (5,5) O Q2 -0.3 (4,5) Q. -0.7(4,5) Which of the following could plausibly cause the change you just observed? A fall in labor taxes A decline in the economy's technological capabilities Advances in technology A rise in labor taxes
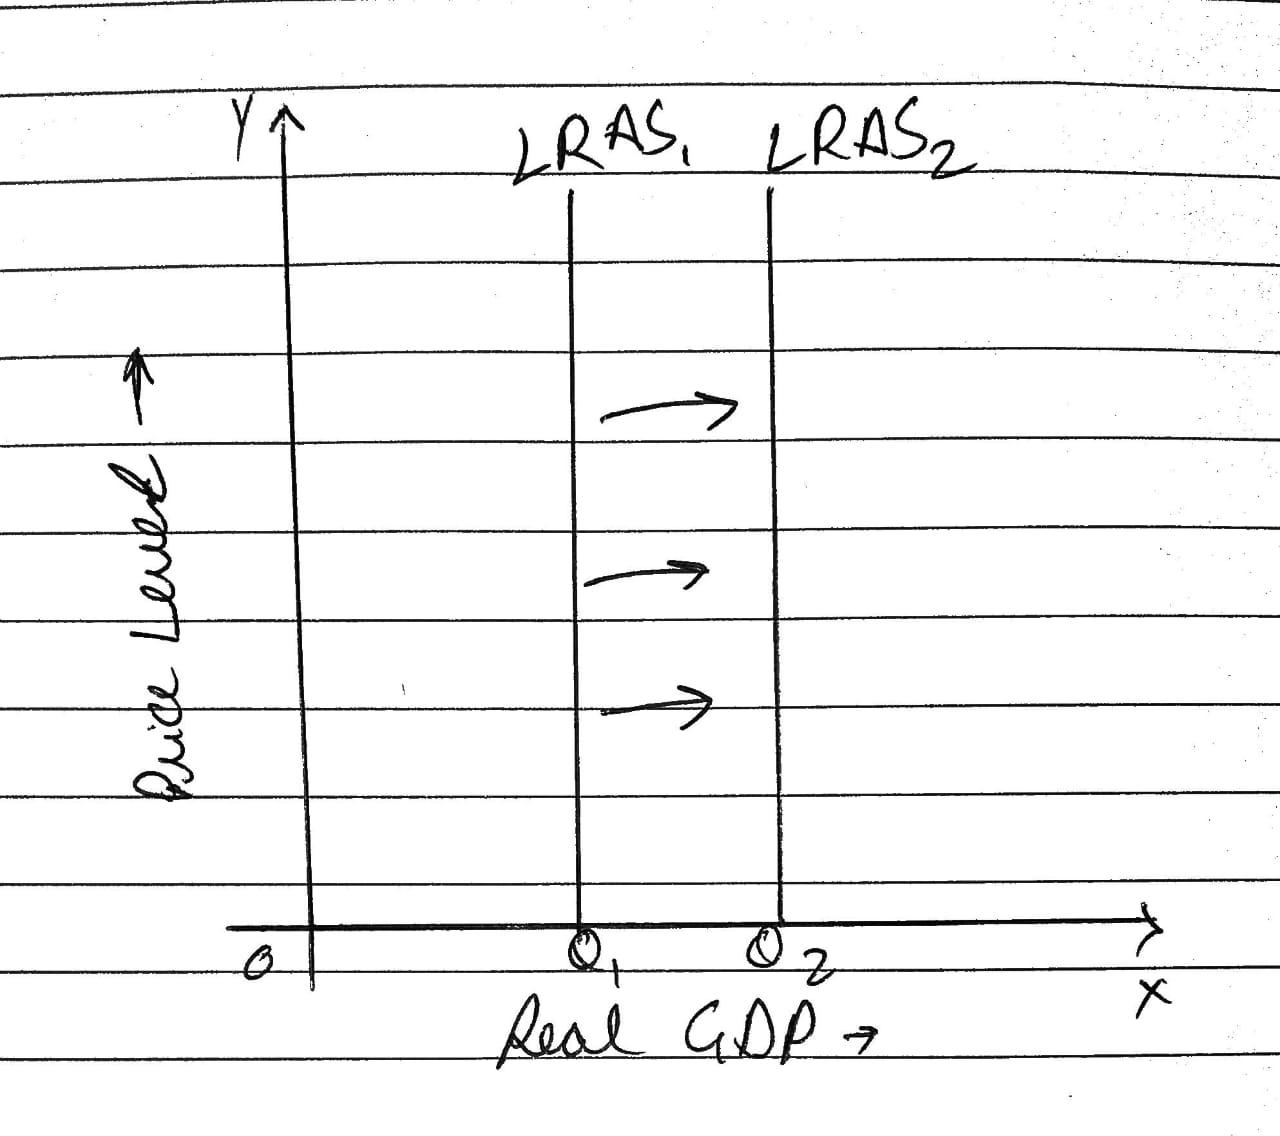
The following graph shows the long-run aggregate supply (LRAS) curve of the economy when it is operating at Point A. If the change previously identified affects the LRAS curve, shift the curve in the correct direction to reflect this change. LRAS 0 LRAS PRICE LEVEL Real GDP (Q) Grade It Now Save & Continue Continue without saving
Expert Solution
ANSWER
Q) Q2=0.7(4,5)
Because the labor remains same as point is just above the initial point A and there is change on Y axis i.e. real GDP which triggers change in other factors
Q) ADVANCES IN TECHNOLOGY
Because from the previous question we can interpret that their is change in term T of function which represents technology as mentioned and it has increased GDP due to its advancement.
Q) it shows a direct impact on LRAS curve, i.e. tech advancment shifts the curve rightwards and moreover the graph depicts an increase in Real GDP. (see the image below)
please see the attached file.
Archived Solution
You have full access to this solution. To save a copy with all formatting and attachments, use the button below.
For ready-to-submit work, please order a fresh solution below.
