


Why Choose Us?
0% AI Guarantee
Human-written only.
24/7 Support
Anytime, anywhere.
Plagiarism Free
100% Original.
Expert Tutors
Masters & PhDs.
100% Confidential
Your privacy matters.
On-Time Delivery
Never miss a deadline.
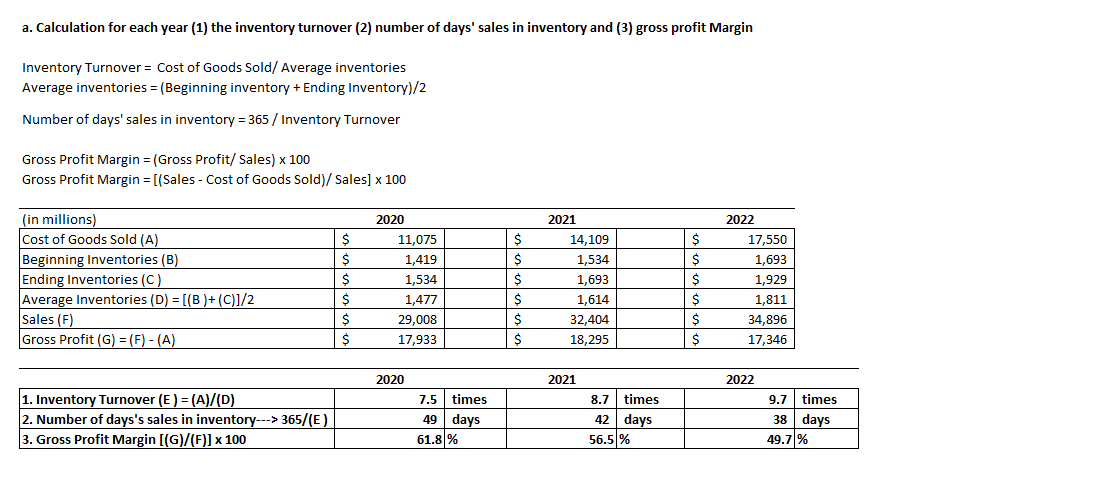
The following information is available for Jones's Bottling Company, Inc
The following information is available for Jones's Bottling Company, Inc. for the most recent three years: (in millions) Inventory Cost of goods sold Sales 2020 $1.534 11.075 29.008 2021 $1,693 14,109 32,404 2022 $1.929 17.550 34,896 Inventory at the end of 2019 was $1.419. Calculate the inventory turnover ratio, days in inventory, and gross profit margin for 2020, 2021, and 2022. (Round inventory turnover ratio and gross profit margin answers to 1 decimal place, eg. 15.2 and round Inventory days to the nearest day, eg 15 days.) 2020 2021 times times Inventory turnover Days in inventory Gross profit margin days days %
2022 es times ?? days %
Expert Solution
please see the attached file.
Archived Solution
You have full access to this solution. To save a copy with all formatting and attachments, use the button below.
For ready-to-submit work, please order a fresh solution below.
