Trusted by Students Everywhere


Why Choose Us?
0% AI Guarantee
Human-written only.
24/7 Support
Anytime, anywhere.
Plagiarism Free
100% Original.
Expert Tutors
Masters & PhDs.
100% Confidential
Your privacy matters.
On-Time Delivery
Never miss a deadline.
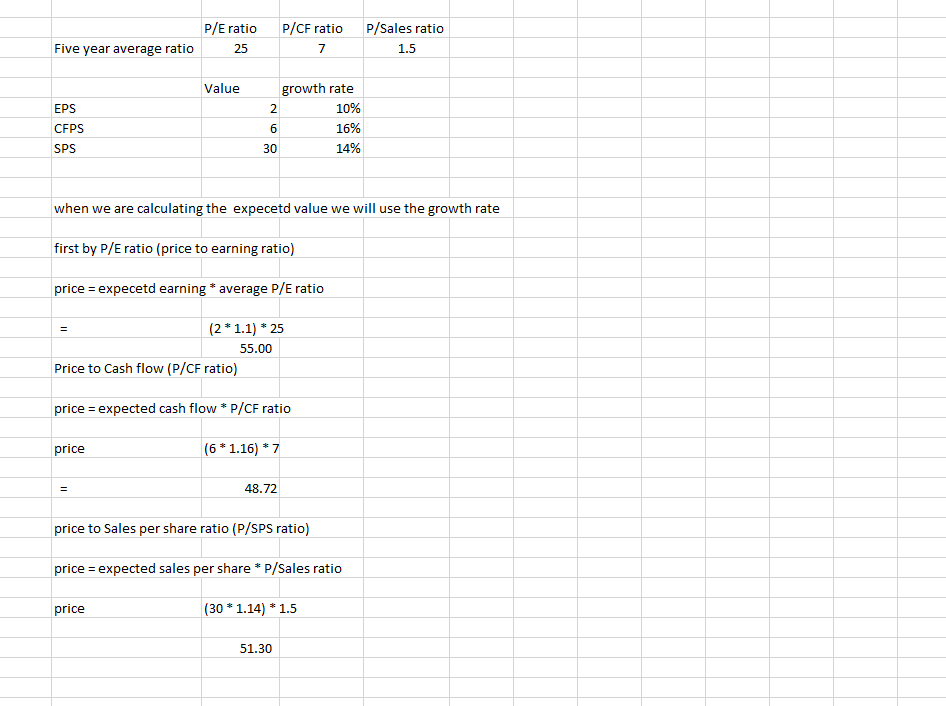
4- The table below contains information about SIM’s company
4- The table below contains information about SIM’s company. Provide expected share prices using each of the three price ratio approaches we have discussed.
Price ratio analysis for SIMS company (Current stock price: $40)
Earnings Cash Flow Sales
Five-year average price ratio 25 (P/E) 7 (P/CF) 1.5 (P/S)
Current Value per share $2 (EPS) $6 (CFPS) $30 (SPS)
Growth Rate 10% 16% 14%
Expert Solution
Please see the attached file
Archived Solution
Unlocked Solution
You have full access to this solution. To save a copy with all formatting and attachments, use the button below.
Already a member? Sign In
Important Note:
This solution is from our archive and has been purchased by others. Submitting it as-is may trigger plagiarism detection. Use it for reference only.
For ready-to-submit work, please order a fresh solution below.
For ready-to-submit work, please order a fresh solution below.
Or get 100% fresh solution
Get Custom Quote
