Trusted by Students Everywhere


Why Choose Us?
0% AI Guarantee
Human-written only.
24/7 Support
Anytime, anywhere.
Plagiarism Free
100% Original.
Expert Tutors
Masters & PhDs.
100% Confidential
Your privacy matters.
On-Time Delivery
Never miss a deadline.
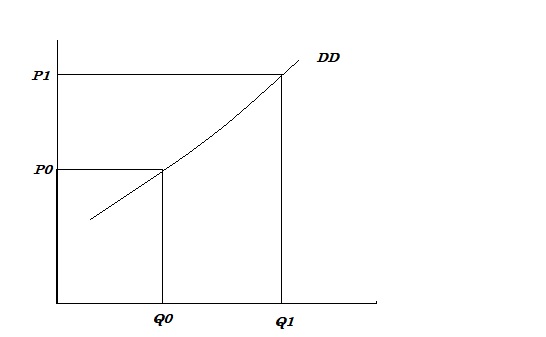
During the last five years, average daily occupancy at Autumn Acres nursing home has slid from 125 to 95 even though Autumn Acres has cut its daily rate from $125 to $115
During the last five years, average daily occupancy at Autumn Acres nursing home has slid from 125 to 95 even though Autumn Acres has cut its daily rate from $125 to $115. How do you graph this?
Expert Solution
Let 0 represent initial and 1 represent the later one.
- Demand, Q0 = 125, Q1 = 95
- Price, P0 = 125 and P1 = 115
As prices have decreased, quantity price has decreased as well. Thus, this is a case of giffen good.
It can be shown in the following demand curve:
please see the attached file for the complete solution
Archived Solution
Unlocked Solution
You have full access to this solution. To save a copy with all formatting and attachments, use the button below.
Already a member? Sign In
Important Note:
This solution is from our archive and has been purchased by others. Submitting it as-is may trigger plagiarism detection. Use it for reference only.
For ready-to-submit work, please order a fresh solution below.
For ready-to-submit work, please order a fresh solution below.
Or get 100% fresh solution
Get Custom Quote
