


Why Choose Us?
0% AI Guarantee
Human-written only.
24/7 Support
Anytime, anywhere.
Plagiarism Free
100% Original.
Expert Tutors
Masters & PhDs.
100% Confidential
Your privacy matters.
On-Time Delivery
Never miss a deadline.
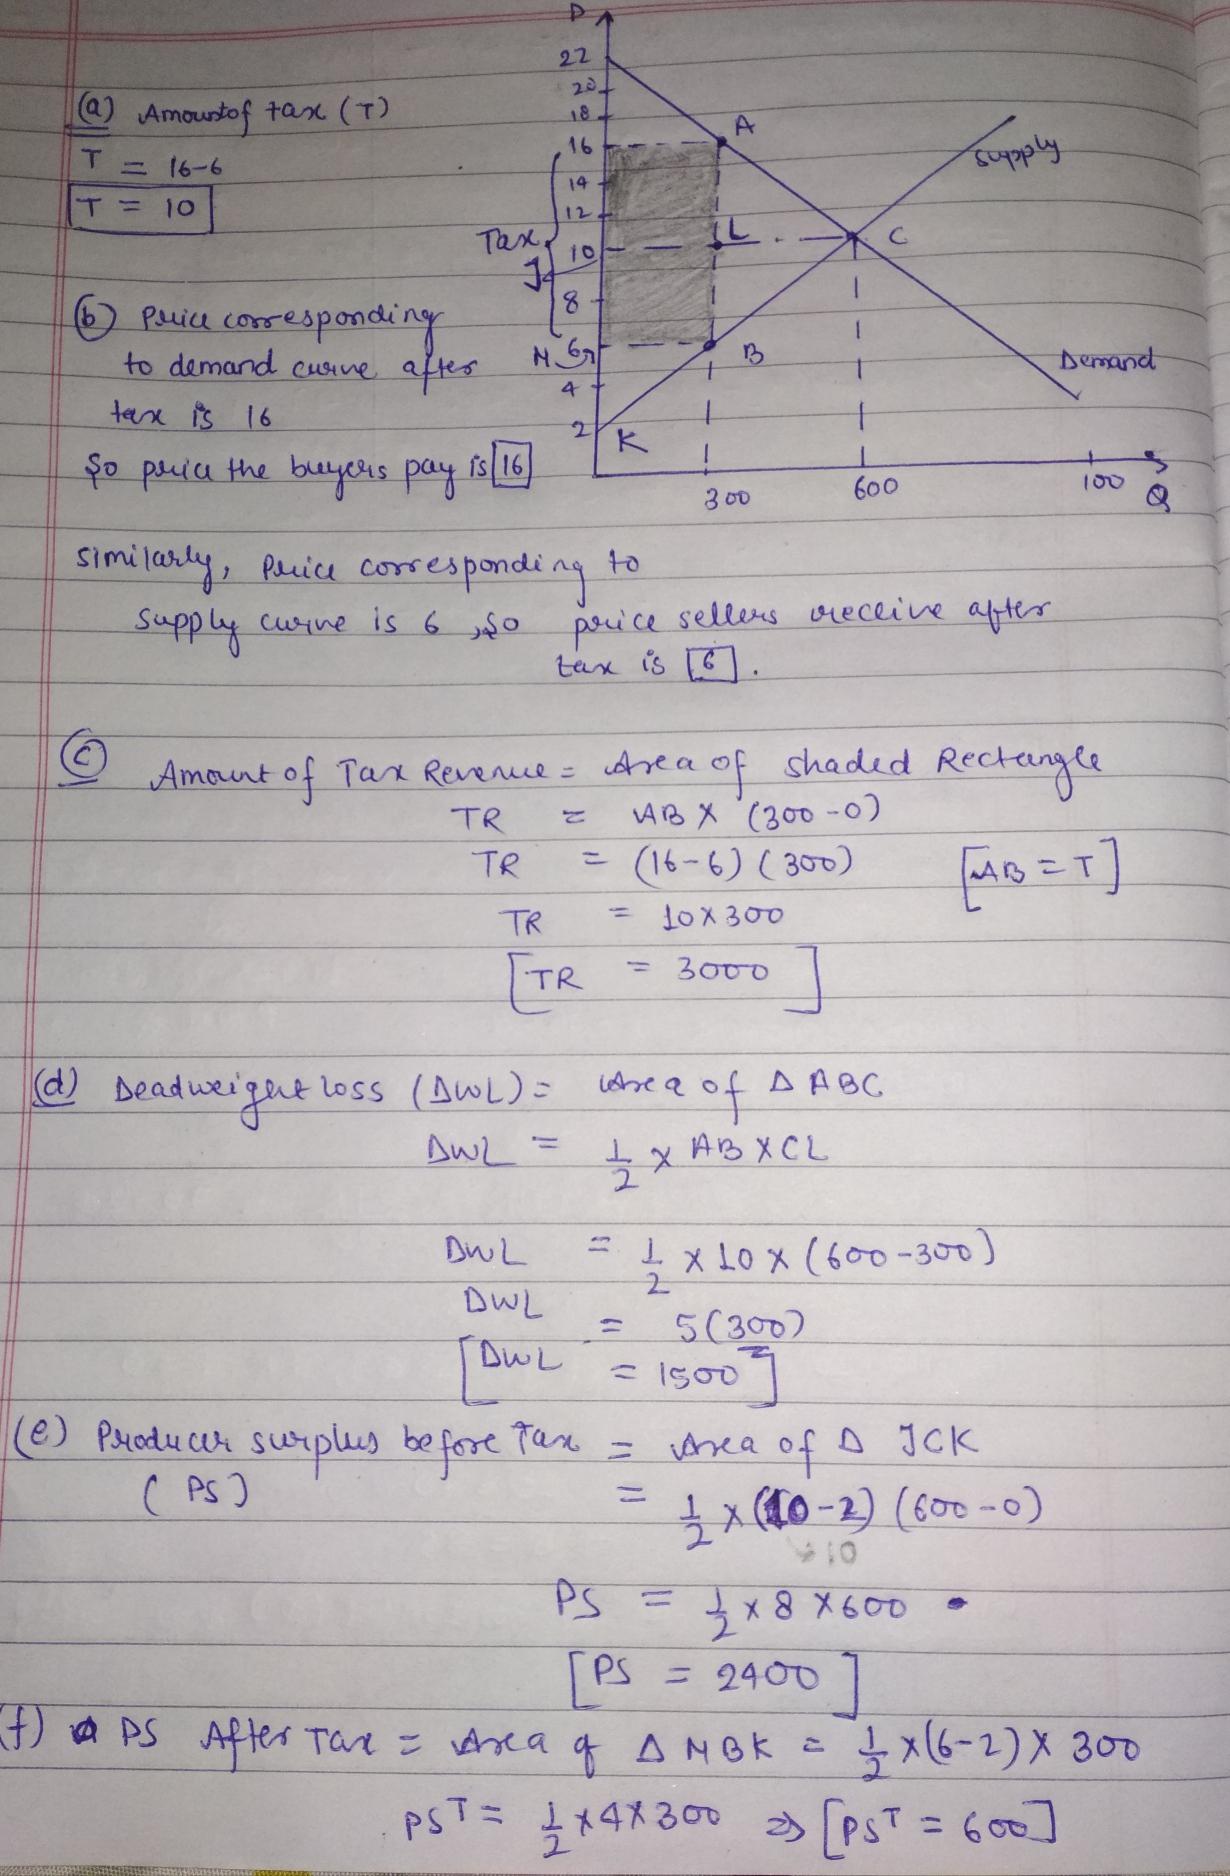
Answer the following questions with respect to the figure below Pie 2015 18+ 16 Supply 14+ 10 Demand 100 100 100 100 100 GOD TO 100 900 100 Ons a) What is the amount of tax in this graph? (0
Answer the following questions with respect to the figure below Pie 2015 18+ 16 Supply 14+ 10 Demand 100 100 100 100 100 GOD TO 100 900 100 Ons a) What is the amount of tax in this graph? (0.5 point) b) What is price the buyers pay and price sellers receive after the tax in place? (1 point) c) What is the amount of tax revenue (0.5 point) d) What is the amount of deadweight loss because of the tax? (1 point) c) Calculate producer surplus without a tax is in place point) +) Calculate producer surplus with the tax (1 point) MacBook Air
Expert Solution
please see the attached file.
Archived Solution
You have full access to this solution. To save a copy with all formatting and attachments, use the button below.
For ready-to-submit work, please order a fresh solution below.
