


Why Choose Us?
0% AI Guarantee
Human-written only.
24/7 Support
Anytime, anywhere.
Plagiarism Free
100% Original.
Expert Tutors
Masters & PhDs.
100% Confidential
Your privacy matters.
On-Time Delivery
Never miss a deadline.
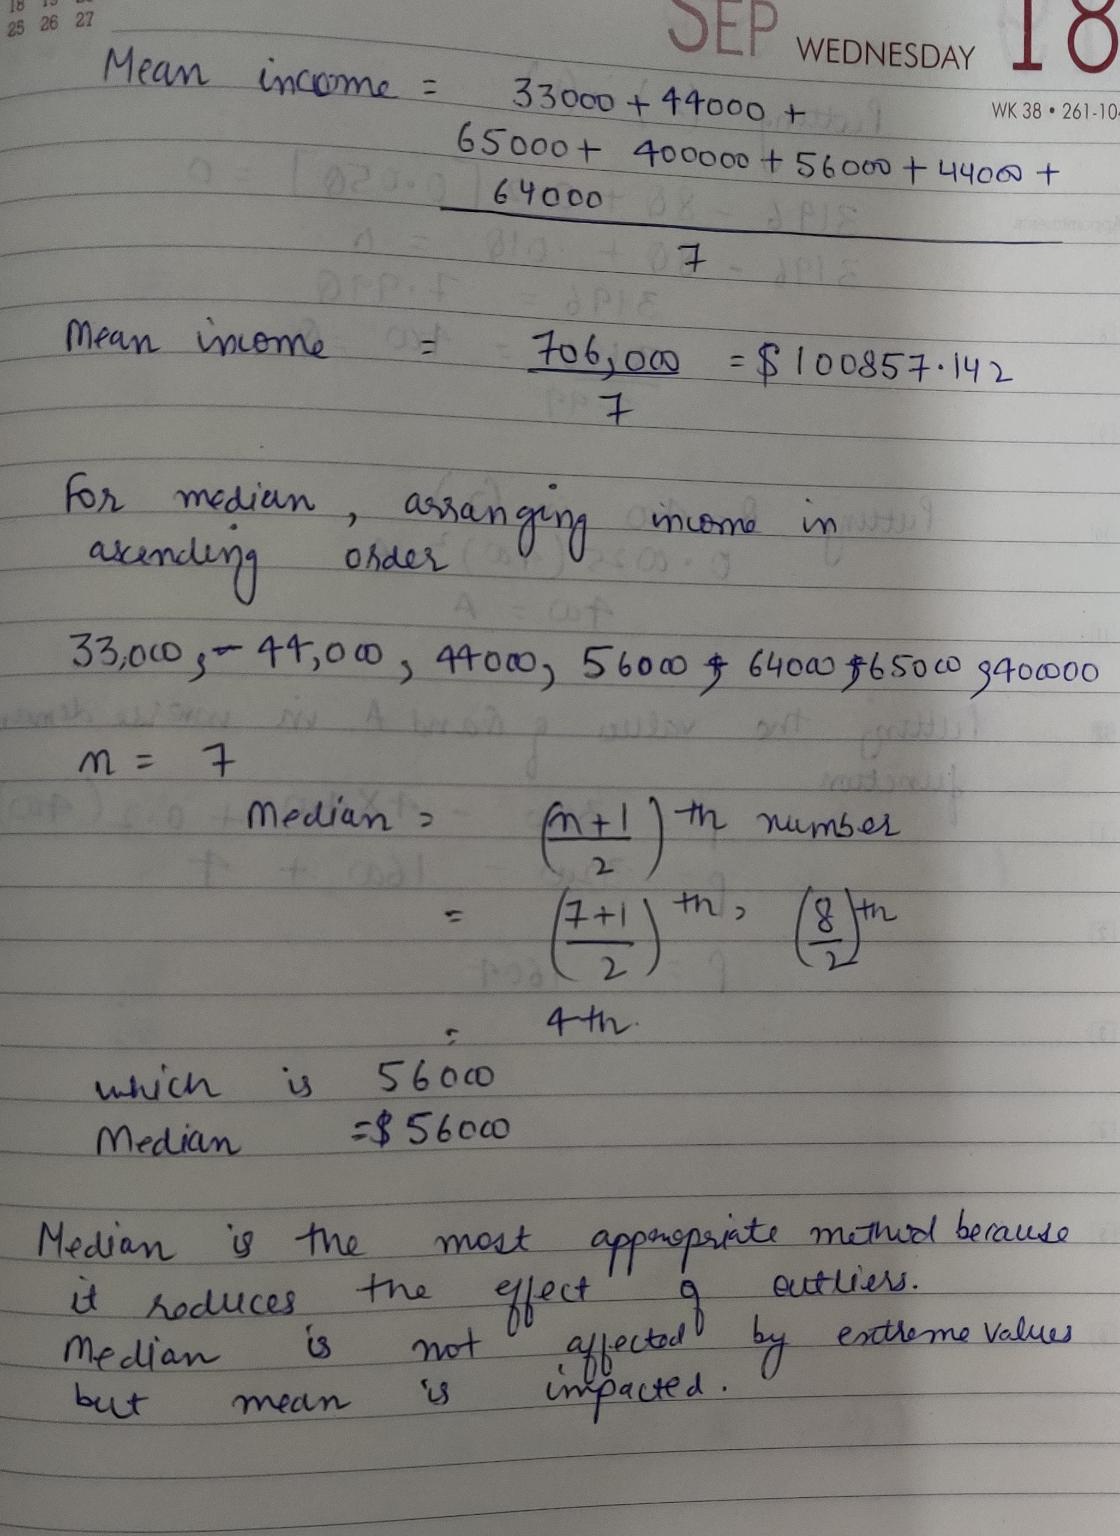
The chart gives the income distribution of Sambala, an island nation in the arctic ocean
The chart gives the income distribution of Sambala, an island nation in the arctic ocean. Ken Leo Michael Marion Joseph Ellen Annual income $33000 $44000 $65000 $400000 $56000 $44000 $64000 Tom What is the mean income in Sambala? mean: $ What is the median income in Sambala? median: $ Which measure is most appropriate for understanding the income situation of the majority of the citizens in Sambala, and why? ??????????????? ?????? ????? career About us prva POGY terms of use contact us hep
SOU Joseph Ellen $44000 $64000 Tom What is the mean income in Sambala? mean: $ What is the median income in Sambala? median: $ Which measure is most appropriate for understanding the income situation of the majority of the citizens in Sambala, and why? The mean is the most appropriate measure, because it incorporates every individual in the economy. The median is the most appropriate measure, because it reduces the effects of outliers. O Both are equally valid because they produce a single monetary measure. ONeither is valid because neither considers the spending levels of citizens in Sambala. racy policy about us contact us Careers terms of use rep
Expert Solution
please see the attached file.
Archived Solution
You have full access to this solution. To save a copy with all formatting and attachments, use the button below.
For ready-to-submit work, please order a fresh solution below.
