


Why Choose Us?
0% AI Guarantee
Human-written only.
24/7 Support
Anytime, anywhere.
Plagiarism Free
100% Original.
Expert Tutors
Masters & PhDs.
100% Confidential
Your privacy matters.
On-Time Delivery
Never miss a deadline.
You have 5,000 you want to invest for the next 45 years until retirement
You have 5,000 you want to invest for the next 45 years until retirement. You are offered an investment plan that will pay you 6 percent per year for the next 15 years and 10 percent per year for the last 30 years. Draw a graph that illustrates the relationship between interest rates and the present value of RM 1,000.00 to be received in one year. (5 marks) Suggest how you can minimise the amount of cash you must invest in order to reach your retirement goal.
Expert Solution
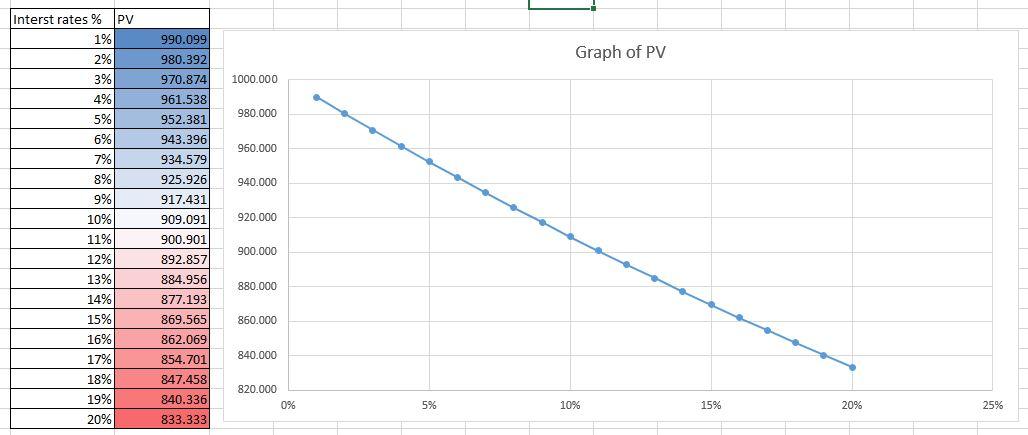
For the Present value of RM 1000 to be received in a year ,’
We use the TVM consideration to plot the graph of the different PV with the interest rates %
So the
PV = FV/( 1+r) ^ 1
Since the time is 1 yr , it is fixed
SO the PV table is
|
Interst rates % |
PV |
|
1% |
990.099 |
|
2% |
980.392 |
|
3% |
970.874 |
|
4% |
961.538 |
|
5% |
952.381 |
|
6% |
943.396 |
|
7% |
934.579 |
|
8% |
925.926 |
|
9% |
917.431 |
|
10% |
909.091 |
|
11% |
900.901 |
|
12% |
892.857 |
|
13% |
884.956 |
|
14% |
877.193 |
|
15% |
869.565 |
|
16% |
862.069 |
|
17% |
854.701 |
|
18% |
847.458 |
|
19% |
840.336 |
|
20% |
833.333 |
Now we plot the graph as PV in the Y axis and rates in the X Axis as
please see the atteched file
Archived Solution
You have full access to this solution. To save a copy with all formatting and attachments, use the button below.
For ready-to-submit work, please order a fresh solution below.
