


Why Choose Us?
0% AI Guarantee
Human-written only.
24/7 Support
Anytime, anywhere.
Plagiarism Free
100% Original.
Expert Tutors
Masters & PhDs.
100% Confidential
Your privacy matters.
On-Time Delivery
Never miss a deadline.
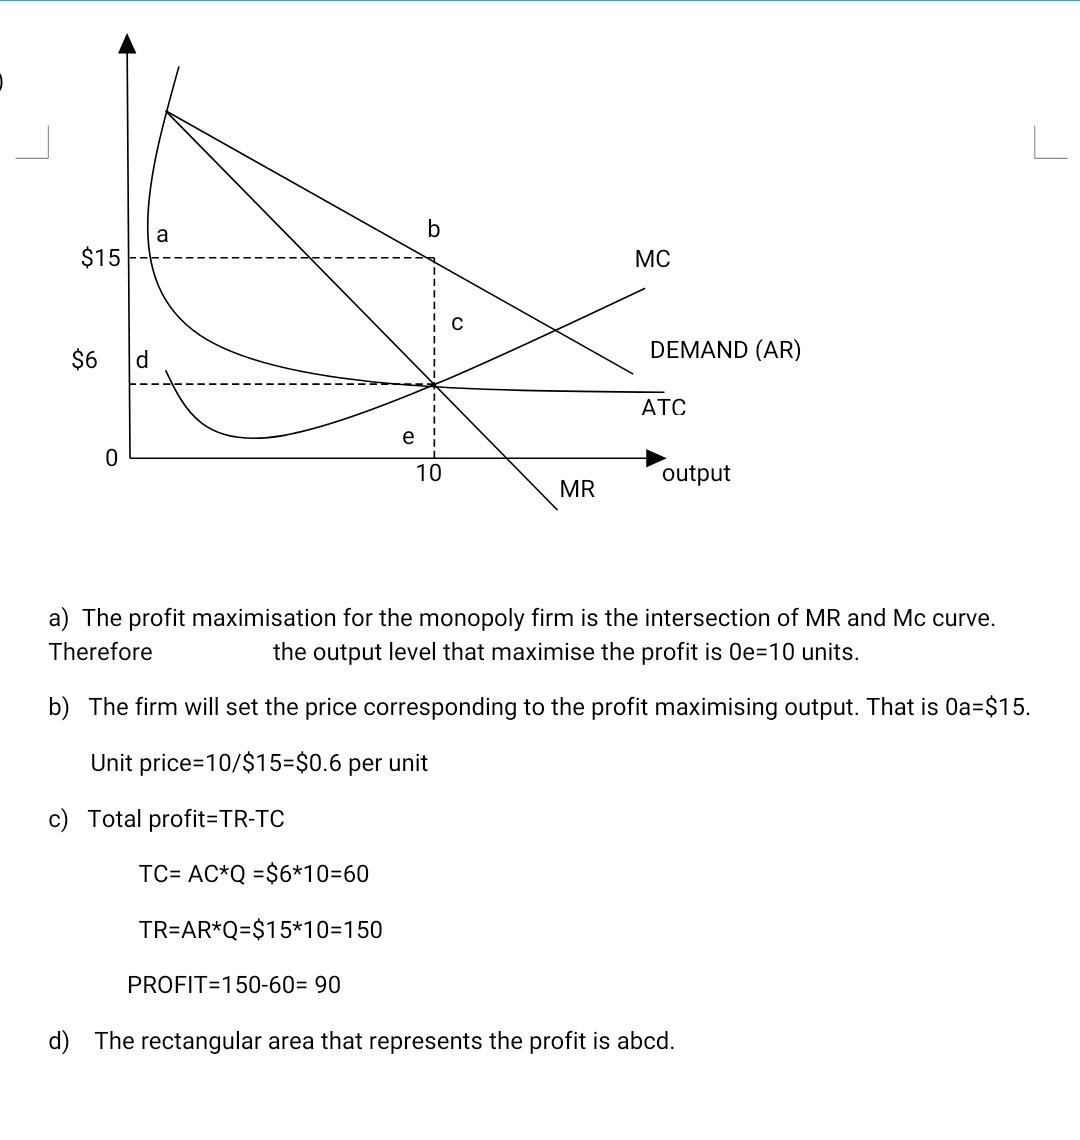
Use the diagram below which represents the demand, marginal revenue, marginal cost, and average total cost curves for a monopoly to answer the following questions: $30 $25 $20 $15 Demand MC $10 $5 ATC MR $0 8 10 12 14 ($5) Output a
Use the diagram below which represents the demand, marginal revenue, marginal cost, and average total cost curves for a monopoly to answer the following questions: $30 $25 $20 $15 Demand MC $10 $5 ATC MR $0 8 10 12 14 ($5) Output a. Identify the output level which maximizes profits for this firm. Explain how you identified this output. b. Identify the unit price that this firm will set for its product in order to maximize profits. Explain how you identified this price level. c. Calculate the total profits of this firm at the output that maximizes profits. Show your work. d. Illustrate on the diagram the rectangular area which represents the firm's total profits from part a.
Expert Solution
please see the attached file.
Archived Solution
You have full access to this solution. To save a copy with all formatting and attachments, use the button below.
For ready-to-submit work, please order a fresh solution below.
