


Why Choose Us?
0% AI Guarantee
Human-written only.
24/7 Support
Anytime, anywhere.
Plagiarism Free
100% Original.
Expert Tutors
Masters & PhDs.
100% Confidential
Your privacy matters.
On-Time Delivery
Never miss a deadline.
Douglas Fur is a small manufacturer of fake fur boots in Denver
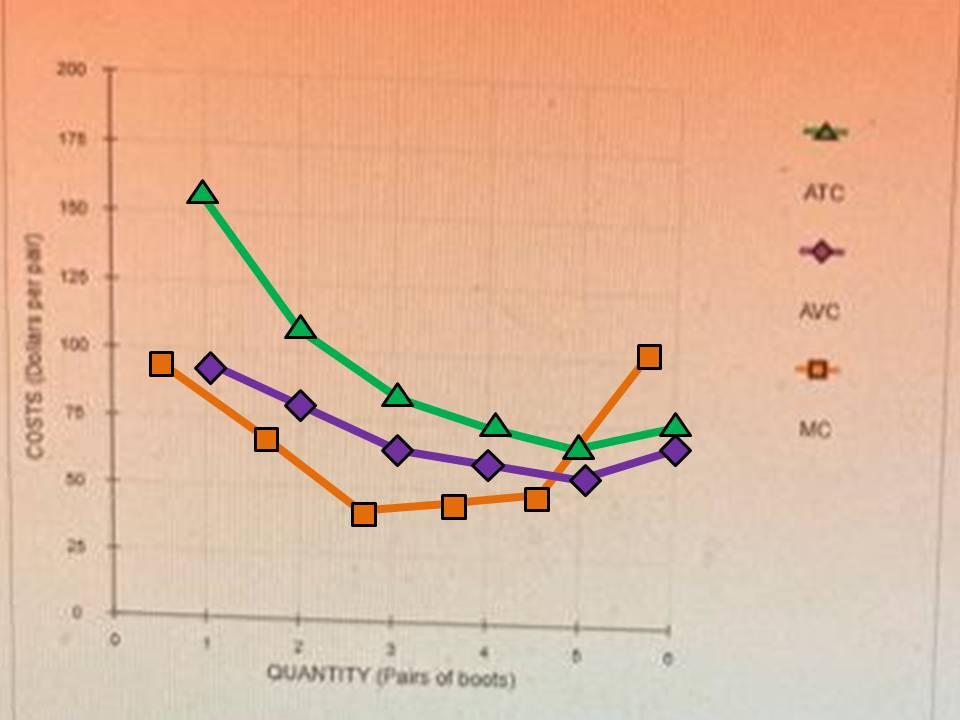
Douglas Fur is a small manufacturer of fake fur boots in Denver. The following table shows the company's total cost of production at various production quantities, Fill in the remaining cells of the following table. od Quantity (Pairs) 0 Total Cost (Dollars) 60 Marginal Cost (Dollars) Average Variable Cost (Dollars per pair) Average Total Cost (Dollars per pair) Fixed Cost (Dollars) 60 60 1 155 95 65 2 220 60 Variable Cost (Dollars) 0 95 160 195 240 290 390 35 3 60 255 300 4 60 45 50 100 350 60 60 6 450 On the following graph, plot Douglas Pur's average total cost (ATC) curve using the green points (triangle symbol). Next, ploe its average variable cost (AVC) curve using the purple points (diamond symbol). Rinally, plot its marginal cost (MC) curve using the orange points (square symbol). (Hint: For ATC and AVC, plot the points on the integer, for example, the ATC of producing one pair of boots is $155, so you should start your ATC curve by placing a green point at(1, 155). For MC, plot the points between the integers: For example, the MC of increasing production from zero to one pair of boots is $95, so you should start your MC curve by placing an orange square at (0.5, 95).) Note: Plot your points in the order in which you would like the connected. Une segments will connect the points automatically. 3
On the following graph, plot Douglas Fur's average total cost (ATC) curve using the green points (triangle symbol). Next, plot its average variable cost (AVC) curve using the purple points (diamond symbol). Finally, plot its marginal cost (MC) curve using the orange points (square symbol). (Hint: For ATC and AVC, plot the points on the integer; for example, the ATC of producing one pair of boots is $155, so you should start your ATC curve by placing a green point at(1, 155), For NC plot the points between the integers: For example, the MC of increasing production from zero to one pair of boots is $95, so you should start your MC curve by placing an orange square at (0.5, 95).) Note: Plot your points in the order in which you would like them connected. Line segments will connect the points automatically 200 ATC 150 120 AVC 100 COSTS Dollars per par 8 MC 0 2 QUANTITY Pairs of boots
Expert Solution
(I) MC, FC & VC are computed correctly.
AVC = VC / Q
ATC = TC / Q
| Q | TC | VC | AVC | ATC |
| 0 | 60 | 0 | ||
| 1 | 155 | 95 | 95 | 155 |
| 2 | 220 | 160 | 80 | 110 |
| 3 | 255 | 195 | 65 | 85 |
| 4 | 300 | 240 | 60 | 75 |
| 5 | 350 | 290 | 58 | 70 |
| 6 | 450 | 390 | 65 | 75 |
please see the attached file for the complet solution.
Archived Solution
You have full access to this solution. To save a copy with all formatting and attachments, use the button below.
For ready-to-submit work, please order a fresh solution below.
