


Why Choose Us?
0% AI Guarantee
Human-written only.
24/7 Support
Anytime, anywhere.
Plagiarism Free
100% Original.
Expert Tutors
Masters & PhDs.
100% Confidential
Your privacy matters.
On-Time Delivery
Never miss a deadline.
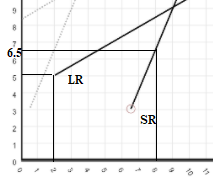
Consider a firm's short-run and long-run supply curves, pictured below
Consider a firm's short-run and long-run supply curves, pictured below. In the short run, one of the inputs to production is fixed. Suppose you know that, at an output of nine units, the fixed factor of production associated with the short-run marginal cost is at its optimal level. You also know that the long-run marginal cost of producing nine units is $9. Using the drag tool, place both the short-run and the long-run supply curves into their correct positions within the graph. (Once you have made the necessary move(s), both supply curves should be entirely within the graph.) To refer to the graphing tutorial for this question type, please click here. ? P 16 15 14 13 12 11 10 9 4 8 f 4 2 Part 2 (3.3 points) See Hint The long-run marginal cost of producing two units of output equals $5 The short-run marginal cost of producing eight units equals $ 0.5
Expert Solution
The graph placed correctly, since optimum level is at 9 units where long-run and short-run supply curve meet at $9 marginal cost.
SR is the short-run curve. The curve is stiff, since there is fixed factor of production. LR is the long-run curve. The curve is flat, since all inputs are variable.
At 2 units, ling-run MC is $5.
It is shown in the following graph, connected to LR on the vertical axis.
At 8 units, short-run MC is $6.5.
It is shown in the following graph, connected to SR on the vertical axis.
please see the attached file for the complet solution.
Archived Solution
You have full access to this solution. To save a copy with all formatting and attachments, use the button below.
For ready-to-submit work, please order a fresh solution below.
